Body Composition Basics # 4
Intro
After having established how to measure your body composition and the components of a useful tracking system, you can use this information and convert it into additional metrics that can further aid your decision-making regarding your physique, performance, and health goals. Here, you’ll learn about these metrics: How they are calculated, what they mean, how you “score” against reference values, and how these reference values can be used to assess your physique, health, and progress toward your goals.
Body Composition Metrics: Calculation, Reference Values and Interpretation
The Basics: BMI and Circumference Metrics
The most commonly used and easy-to-access body composition metrics are the Body Mass Index (BMI) and circumference metrics. As discussed, these metrics are limited regarding their usefulness because they do not directly tell you what (and how much of that) your body is composed of. Despite their limitations, they remain widely used tools for quick physique and health assessments.
Body Mass Index (BMI)
Let’s start with the most well-known metric, the BMI. It is calculated according to the following formula:
BMI = total body mass (kg) ÷ height² (m²)
Therefore, the BMI relates your weight to your height. According to the World Health Organization, for adults, the BMI can be categorized as follows [1]:
- Underweight: <18.5
- Normal weight: 18.5 – 24.9
- Overweight: 25 – 29.9
- Obese: ≥30
While the BMI is easy to calculate and widely used, it’s important to note its limitations. BMI doesn’t distinguish between fat mass (FM) and fat-free mass (FFM) – and therefore also not muscle mass –, which can lead to misclassifications, especially in athletes or individuals with high muscle mass [2]. That is, high BMI values do not necessarily imply high amounts of fat. Additionally, even in the case of higher BMI values due to more fat, it does not tell you how the fat is distributed across the body [3].
However, if the BMI is used in conjunction with other metrics like the ones below or as previously outlined and you can be quite certain that a high BMI results from a lot of body fat, you should use this information as an indication to drop your weight (i.e., fat) to reduce your BMI back into normal ranges.
In the case of a low BMI, there is even less room for interpretation: There is (too) little body mass overall for the respective body size, regardless of body composition. A (very) low BMI should raise awareness to avoid possible health complications due to malnutrition [4].
Waist Circumference (WC) & Waist-to-Hip Ratio (WHR)
Although circumference measurements by nature do not allow us to directly identify the composition of tissues beneath the measured sites, they carry useful information for physique and health assessment. Especially the waist is a good place to start. Make sure to always measure the waist in the same place (i.e., at the level of the belly button) with the measuring tape lying directly on the skin without any additional pressure (here you find a suggested body measuring tape that allows for easy and consistent measurements). Here are commonly used reference values for adults concerning health risk exposure [5]:
For men:
- Increased risk: ≥ 94 cm
- Greatly increased risk: ≥ 102 cm
For women:
- Increased risk: ≥ 80 cm
- Greatly increased risk: ≥ 88 cm
As abdominal muscles only account for a relatively small (but largely stable) portion of your waist, waist circumference (WC) is an important measure for assessing abdominal obesity and associated health risks because high values and circumference changes are primarily driven by fat [6]. Therefore, having a WC above these indicated thresholds, you might start considering reducing your body fat.
However, because WC correlates with age and differs between sexes [7] [8], alternative measures used in a complementary manner can account for these limitations. The Waist-to-Hip Ratio (WHR) is calculated according to:
WHR = waist circumference ÷ hip circumference
In a similar vein, you could also calculate the Waist-to-Height Ratio (WHtR) by dividing the WC by your height as it also controls for associated differences in relevant demographic variables. In line with the risk categories for the WC, the World Health Organization classifies the WHR as follows [9]:
For men:
- Low health risk: ≤ 0.95
- Moderate health risk: 0.96 – 1.0
- High health risk: ≥ 1.0
For women:
- Low health risk: ≤ 0.80
- Moderate health risk: 0.81 – 0.85
- High health risk: ≥ 0.86
The health risks found to be associated with a higher WHR range from hypertension to diabetes (e.g., [10]). Irrespective of whether you are in acute danger of developing these conditions, a high WHR is a strong indicator of excess body fat with its associated drawbacks [6].
Beyond the Basics: Additional Body Composition Metrics
In line with the different models of body composition, there are metrics beyond the discussed basics that revolve more directly around the body compartments of interest: fat and muscle. However, as it is generally easier to somewhat accurately determine your body fat as opposed to your muscle mass (at least without an accurate BIA scale), the metrics revolving around body fat might be more accessible to you.
Body Fat Percentage (%BF) & Fat Mass Index (FMI)
The most straightforward metric of “actual” body composition is %BF, the amount of fat mass (FM) relative to total body mass:
%BF = (FM ÷ total body mass) × 100
Rough reference values for physically fit adults in their 20s are the ones below [11]. However, note that these values typically increase with age [12] and differ across further demographic variables like ethnicity [13]:
- Men: 15%
- Women: 23%
That is, men generally have a considerably lean physique and associated health benefits between 10% and 20% body fat, whereas for women you just add 8% on top (i.e., 18% – 28%). Furthermore, a %BF falling in that range is a great foundation to start building some muscle because too low of a %BF makes you more prone to (re-)gain body fat [14] [15] [16]. Similarly, too high of a %BF – besides its associated risks – is likely to limit your hypertrophy endeavors, for example via unfavorable hormonal profiles [17].
If you know your FM, you can also calculate your Fat Mass Index (FMI) according to:
FMI = FM (kg) ÷ height² (m²)
Therefore, the higher your FMI, the more body fat you carry around relative to your height. As with %BF, FMI reference values depend on various demographic factors like age and ethnicity [18] [19] [20]. Furthermore, the FMI is not as commonly used as a body composition metric as the others discussed, therefore, widely accepted reference values are somewhat difficult to state. Nevertheless, if you are younger than 35, your FMI should fall below the following threshold, otherwise you are probably well advised to get rid of some body fat:
- Men: < 6.0 kg/m²
- Women: < 8.5 kg/m²
Despite the FMI not being a very commonly used metric, it has been shown to be more predictive than BMI and even %BF regarding health-associated risk factors like metabolic syndrome [21]. Therefore, it can be valuable to evaluate it occasionally.
Muscle Mass Percentage (%MM), Skeletal Muscle Index (SMI), Fat-Free Mass Index (FFMI) & Lean Mass Index (LMI)
The equivalent of %BF for muscle mass (MM) is %MM, calculated as the amount of (skeletal) MM relative to total body mass:
%MM = (MM ÷ total body mass) × 100
It gets a little bit complicated regarding reference values of %MM. A fundamental issue is that descriptive values in healthy populations are somewhat sparse, meaning that there are not many studies explicitly measuring the %MM of large amounts of people for other than clinical purposes [22] [23]. However, one exception displays the following reference values for an average study population [24]:
For men:
- 18-35 years: 40% – 44%
- 36-55 years: 36% – 40%
- 56-75 years: 32% – 35%
For women:
- 18-35 years: 31% – 33%
- 36-55 years: 29% – 31%
- 56-75 years: 27% – 30%
There are a couple of things to note here. First, muscle mass is lower for women. Second, it declines with age, making %MM an important metric for assessing sarcopenia, the age-related loss of muscle mass and function. Third, these are descriptive and not normative (or prescriptive) values: These values describe the %MM of the studied individuals and do not prescribe what the norm should be. However, there is basically no such thing as too much muscle – at least if gained naturally. This is why you should aim to raise your %MM to or above the upper threshold of the 18-35 years age range and keep it there.
Knowing your muscle mass also allows you to calculate the Skeletal Muscle Index (SMI). Equivalent to FMI, the SMI is a relative metric of muscle mass adjusted for height. Although there are several ways to conceptualize the SMI due to the complexity of accurately determining muscle mass [22], in line with FMI there is the following formula:
SMI = MM (kg) / height² (m²)
With regards to the SMI, it gets even more complicated to find reference values that are useful for everyday non-clinical evaluation purposes because of the different conceptualizations. For example, oftentimes only the appendicular muscles – meaning the muscle mass of the limbs – are considered in clinical studies. Nevertheless, if you have access to your SMI, you should generally aim for high(er) values and keep them as high as possible for as long as possible.
Due to the difficulty of accurately determining your muscle mass without proper equipment, there are more widely used but not as distinct metrics compared to the SMI regarding the non-fat body components. The Fat-Free Mass Index (FFMI) indicates the amount of non-fat tissue (fat-free mass; FFM) relative to height. As the FFM is calculated as the difference between body fat to total body weight, you can determine it more easily than muscle mass alone. Equivalently to the FFMI, the Lean Mass Index (LMI) indicates lean body mass (LBM) relative to height. You can calculate these two metrics with equivalent formulas, however, FFMI calculation usually includes a small adjustment factor [25]:
FFMI = FFM (kg) ÷ height² (m²) + 6.3 × (1.8 – height (m))
LMI = LBM (kg) ÷ height² (m²)
As explained here, both FFM and LBM contain all non-(storage-)fat components (organs, bones, muscles, and body water). The difference is that LBM but not FFM includes essential fat (e.g. fat in the cell walls of neurons). Essential body fat amounts to around 3 – 5% of total body weight [26], therefore LBM results in higher values for an individual compared to his or her FFM – and consequently LMI vs. FFMI.
Despite the conceptual difference, FFM / FFMI are often used synonymously with LBM / LMI, respectively, due to several reasons. First, as the amount of essential body fat is rather small relative to your total body weight and also quite stable over time, it is practically not very relevant for everyday purposes. Second, researchers argue that even the difference on the conceptual and chemical level is often not given [27]. Therefore, focusing on the FFMI is sufficient most of the time. With regards to reference values, you can interpret the FFMI according to the following ranges:
For men:
- Weak: 16 – 17
- Normal: 18 – 20
- Good: 21 – 22
- Very good: 23 – 24
- Natural upper limit: 25
For women:
- Weak: 13 – 14
- Normal: 15 – 16
- Good: 17 – 18
- Very good: 19 – 20
- Natural upper limit: 22
These ranges are extrapolated based on research that analyzed the FFMI values that typically can be achieved by muscle mass gained without vs. with steroid use [25]. As mentioned before, higher values are generally better than lower values, as there is no immanent drawback of having more muscle. However, FFMI values exceeding the upper limit are indicative (or at least suspicious) of steroid use, but per se not problematic.
Application Recommendations: Interpret these Metrics in Context
When assessing your body composition based on these metrics, remember that each of them should be interpreted in the context of your individual predispositions and circumstances as well as your specific physique, performance, and health goals. Keep in mind that:
- Demographics matter: Reference values for most body composition metrics vary based on age, sex, and other variables. What’s considered “normal” or “ideal” for a 25-year-old male athlete will be different from what’s appropriate for a 60-year-old female.
- Consider your goals: If you’re an athlete or bodybuilder, you might aim for values on these metrics that would be considered extreme for the general population. Conversely, if your goal is general health and longevity, more moderate values might be appropriate.
- Track over time: Often, the most valuable information comes from tracking how your body composition changes in response to diet and exercise interventions, rather than focusing on absolute values.
- Be consistent: If you’re tracking your body composition over time, use the same measurement method and device for consistency to get information that is actually useful.
Regarding the different metrics, no single one tells the whole story. Therefore, use a combination of those metrics to get a comprehensive picture of your body composition.
In line with and in addition to our suggested tracking system, a good starting point due to being easily accessible is your BMI. If you are not overly muscular, your BMI gives you a hint of whether you are too heavy (or light) given your height and if you might run into associated health risks. That’s it, however, as the BMI does not differentiate between different body compartments and therefore is of limited use if you are considerably muscular – something you should aim for to at least some degree.
The WHR is also easily accessible and already more informative than your BMI because fat is not evenly distributed, gained and lost around the body and the size of your ab muscles is relatively stable. This makes the WHR a good initial indication of whether you carry too much body fat. Furthermore, changes in the WHR – ideally measured weekly – are very sensitive to changes in body fat, therefore, WHR increases and decreases are very likely due to gains and reductions in body fat, respectively.
Directly keeping an eye on your %BF is obviously a more straightforward assessment of your body composition. Regularly checking your %BF can be easily done with a good BIA scale at home, providing you with considerably (depending on the vendor and model) accurate measures of body fat and body fat changes over time.
Additionally, it’s definitely worthwhile to calculate your FMI and FFMI for reference every once in a while. Once you know your %BF, you can also easily calculate your FFMI which gives you a solid indication about your muscle mass and muscle mass changes. That is, you do not only want to keep your body fat in healthy target ranges (according to your goals) but also want to ensure that you have, build, and keep healthy amounts of muscle mass.
Take-Aways
In the graphic, you can see a summary of the metrics that are easily accessible and holistically provide you with a good evaluation of your body composition.
Summary of the Body Composition Metrics
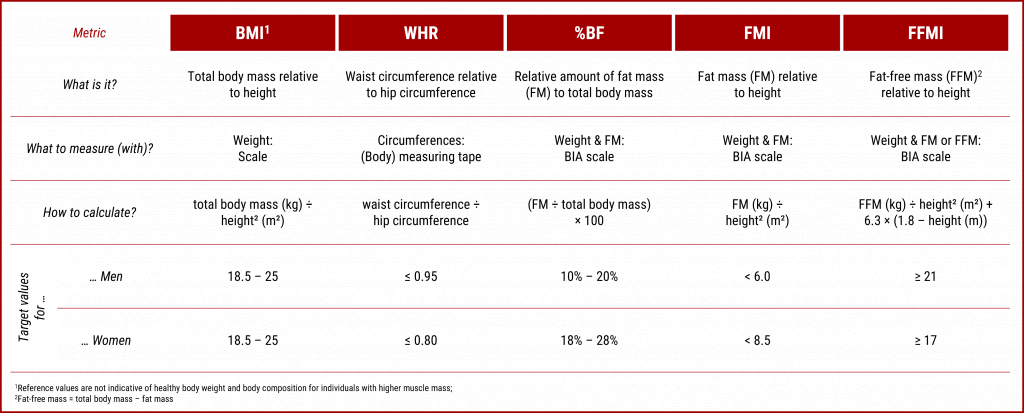
However, note that the target reference values might have to be adjusted according to your individual goals and circumstances. Nevertheless, hitting those targets will most likely benefit you for the better.
Outlook
In the next post on body composition basics, we’ll cover why it is actually important to keep your body fat and muscle mass in healthy ranges. That is, you’ll find information about the specific effects that fat and muscle tissue have on different health and performance markers like hormone levels, mood, and cognitive abilities.
References
[1] World Health Organization, “A healthy lifestyle – WHO recommendations.” Accessed: Jan. 06, 2025. [Online]. Available: https://www.who.int/europe/news-room/fact-sheets/item/a-healthy-lifestyle—who-recommendations
[2] W. D. Van Marken Lichtenbelt, F. Hartgens, N. B. J. Vollaard, S. Ebbing, and H. Kuipers, “Body Composition Changes in Bodybuilders: A Method Comparison,” Med. Sci. Sports Exerc., vol. 36, no. 3, pp. 490–497, Mar. 2004, doi: 10.1249/01.MSS.0000117159.70295.73.
[3] F. Q. Nuttall, “Body Mass Index: Obesity, BMI, and Health A Critical Review,” Nutr. Today, vol. 50, no. 3, pp. 117–128, May 2015, doi: 10.1097/NT.0000000000000092.
[4] K. Maeda, Y. Ishida, T. Nonogaki, and N. Mori, “Reference body mass index values and the prevalence of malnutrition according to the Global Leadership Initiative on Malnutrition criteria,” Clin. Nutr., vol. 39, no. 1, pp. 180–184, Jan. 2020, doi: 10.1016/j.clnu.2019.01.011.
[5] Healthdirect, “Body mass index (BMI) and waist circumference.” Accessed: Jan. 06, 2025. [Online]. Available: https://www.healthdirect.gov.au/body-mass-index-bmi-and-waist-circumference
[6] R. Ross et al., “Waist circumference as a vital sign in clinical practice: a Consensus Statement from the IAS and ICCR Working Group on Visceral Obesity,” Nat. Rev. Endocrinol., vol. 16, no. 3, pp. 177–189, Mar. 2020, doi: 10.1038/s41574-019-0310-7.
[7] J. Lee, S.-C. Kang, O. Kwon, S. Hwang, J. S. Moon, and J. Kim, “Reference Values for Waist Circumference and Waist–Height Ratio in Korean Children and Adolescents,” J. Obes. Metab. Syndr., vol. 31, no. 3, pp. 263–271, Sep. 2022, doi: 10.7570/jomes22033.
[8] B. Xi et al., “International Waist Circumference Percentile Cutoffs for Central Obesity in Children and Adolescents Aged 6 to 18 Years,” J. Clin. Endocrinol. Metab., vol. 105, no. 4, pp. e1569–e1583, Apr. 2020, doi: 10.1210/clinem/dgz195.
[9] World Health Organization, “Waist circumference and waist-hip ratio: Report of a WHO expert consultation,” 2008, Accessed: Jan. 06, 2025. [Online]. Available: https://iris.who.int/handle/10665/44583
[10] R. Fauziana et al., “Body mass index, waist-hip ratio and risk of chronic medical condition in the elderly population: results from the Well-being of the Singapore Elderly (WiSE) Study,” BMC Geriatr., vol. 16, no. 1, p. 125, Dec. 2016, doi: 10.1186/s12877-016-0297-z.
[11] A. W. Potter, W. J. Tharion, L. J. Nindl, D. M. McEttrick, D. P. Looney, and K. E. Friedl, “The normal relationship between fat and lean mass for mature (21–30 year old) physically fit men and women,” Am. J. Hum. Biol., vol. 36, no. 1, p. e23984, Jan. 2024, doi: 10.1002/ajhb.23984.
[12] Y. Schutz, U. Kyle, and C. Pichard, “Fat-free mass index and fat mass index percentiles in Caucasians aged 18–98 y,” Int. J. Obes., vol. 26, no. 7, pp. 953–960, Jul. 2002, doi: 10.1038/sj.ijo.0802037.
[13] A. Luke, “Ethnicity and the BMI–body fat relationship,” Br. J. Nutr., vol. 102, no. 04, p. 485, Aug. 2009, doi: 10.1017/S0007114508207233.
[14] E. T. Trexler, “The Metabolic Adaptation Manual: Problems, Solutions, and Life After Weight Loss,” Stronger by Science. Accessed: Nov. 17, 2024. [Online]. Available: https://www.strongerbyscience.com/metabolic-adaptation/
[15] P. S. MacLean, J. A. Higgins, E. D. Giles, V. D. Sherk, and M. R. Jackman, “The role for adipose tissue in weight regain after weight loss,” Obes. Rev., vol. 16, no. S1, pp. 45–54, Feb. 2015, doi: 10.1111/obr.12255.
[16] J. Peos, L. Norton, E. Helms, A. Galpin, and P. Fournier, “Intermittent Dieting: Theoretical Considerations for the Athlete,” Sports, vol. 7, no. 1, p. 22, Jan. 2019, doi: 10.3390/sports7010022.
[17] P. G. Cohen, “The hypogonadal–obesity cycle: role of aromatase in modulating the testosterone–estradiol shunt – a major factor in the genesis of morbid obesity,” Med. Hypotheses, vol. 52, no. 1, pp. 49–51, Jan. 1999, doi: 10.1054/mehy.1997.0624.
[18] B. R. D. Oliveira et al., “Performance of Body Fat Percentage, Fat Mass Index and Body Mass Index for Detecting Cardiometabolic Outcomes in Brazilian Adults,” Nutrients, vol. 15, no. 13, p. 2974, Jun. 2023, doi: 10.3390/nu15132974.
[19] A. Coin et al., “Fat-free mass and fat mass reference values by dual-energy X-ray absorptiometry (DEXA) in a 20–80 year-old Italian population,” Clin. Nutr., vol. 27, no. 1, pp. 87–94, Feb. 2008, doi: 10.1016/j.clnu.2007.10.008.
[20] D. Masih et al., “Optimal Cut-Off Values for Body Mass Index and Fat Mass Index Based on Age in Physically Active Males Using Receiver Operating Characteristic Curve,” Diseases, vol. 11, no. 4, p. 137, Oct. 2023, doi: 10.3390/diseases11040137.
[21] P. Liu, F. Ma, H. Lou, and Y. Liu, “The utility of fat mass index vs. body mass index and percentage of body fat in the screening of metabolic syndrome,” BMC Public Health, vol. 13, no. 1, p. 629, Dec. 2013, doi: 10.1186/1471-2458-13-629.
[22] C. O. Walowski et al., “Reference Values for Skeletal Muscle Mass – Current Concepts and Methodological Considerations,” Nutrients, vol. 12, no. 3, p. 755, Mar. 2020, doi: 10.3390/nu12030755.
[23] A. Van Der Werf et al., “Percentiles for skeletal muscle index, area and radiation attenuation based on computed tomography imaging in a healthy Caucasian population,” Eur. J. Clin. Nutr., vol. 72, no. 2, pp. 288–296, Feb. 2018, doi: 10.1038/s41430-017-0034-5.
[24] I. Janssen, S. B. Heymsfield, Z. Wang, and R. Ross, “Skeletal muscle mass and distribution in 468 men and women aged 18–88 yr,” J. Appl. Physiol., vol. 89, no. 1, pp. 81–88, Jul. 2000, doi: 10.1152/jappl.2000.89.1.81.
[25] E. M. Kouri, H. G. Pope, D. L. Katz, and P. Oliva, “Fat-free mass index in users and nonusers of anabolic-androgenic steroids,” Clin. J. Sport Med. Off. J. Can. Acad. Sport Med., vol. 5, no. 4, pp. 223–228, Oct. 1995, doi: 10.1097/00042752-199510000-00003.
[26] S. Janmahasatian, S. B. Duffull, S. Ash, L. C. Ward, N. M. Byrne, and B. Green, “Quantification of Lean Bodyweight,” Clin. Pharmacokinet., vol. 44, no. 10, pp. 1051–1065, Oct. 2005, doi: 10.2165/00003088-200544100-00004. [27] S. B. Heymsfield, J. Brown, S. Ramirez, C. M. Prado, G. M. Tinsley, and M. C. Gonzalez, “Are Lean Body Mass and Fat-Free Mass the Same or Different Body Components? A Critical Perspective,” Adv. Nutr., vol. 15, no. 12, p. 100335, Dec. 2024, doi: 10.1016/j.advnut.2024.100335.